
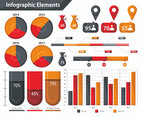
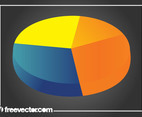
Three-dimensional pie chart with four sections with different sizes, heights and colors. Shiny red, yellow, blue and green sectors to represent different data in a survey. Colorful graph vector to illustrate survey results in science, statistic, learning and information design themes. Colorful Graph by VectorFresh.com


Copy this link (right-click + 'copy') on your web

200,000+ Vectors
from $9.99 / month
Any questions? Visit the FAQ
200,000+ Vectors
from $9.99 / month
Any questions? Visit the FAQ