Diagram

Diagram

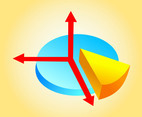
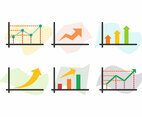
Vector graphics of a visual representation of survey data. Detailed glossy graph with columns shaped like three-dimensional speech bubbles and thin long arrow showing growth. Free vector graphics for business presentations, surveys, statistics, improvement and growth visuals. Graph Vector by VectorOpenStock.com

License:

This file is distributed under the Creative Commons Attribution 4.0 license.

Similar vectors

People Analyze Data On Donut Graph
Classic Infographic Collection Vector
Newspaper Mobile Icons Vector
Stained Infographics Vector
Phone Graphics Vector
Monitor Graphics Vector
Newspaper Rocket Vector
Flat Infographics Icons
World Map Retro Graphics Vector
Monitor Statistics Vector
Newspaper Startup Infographic Vector
People Analyze Statistics With Graph Data Visualization
People Using Cloud Computing Services To Analyze Statistical Data
People Analyze Statistics With Graph Data Visualization
Colorful Vector Diagram
Diagram Vector
3D Pie Chart
Charts Footage
3D Business Icons
Diagrams Vector
Charts Vectors
Graphs
Pie Charts
Diagram Vector Graphics
Business Infographics Element Set
Speech Bubbles Icons
Stars And Colors
Growth Diagram
Ribbon Infography Vectors
Diagrams Vectors
Speech Balloon Vector
Modern Company Profile Illustration Template
Diagram Vectors
Step By Step infographic Concept
Technorati Icons
Step by Step infographic Template
Infographic Element Template
3D Infographic Element Chart Template
3D Infographic Element Template
Growth Chart Graphics
Paperclip
Abstract Shapes Graphics
Globe Vector
Growth Diagram Vector
Icons Vector Graphics Set
Infographic Element Template Set
Stats Icons
Stats Vectors
3D Arrow Graphics
Shiny Graph Icons
Speech Bubble Illustration
Shiny Stickers Set
Pound Icons
Infographic Step by Step Modern Style Concept
Infographic Progress Modern Style Concept
Business Infographic Weekly Timeline Template
Business Infographic Template with 5 Steps of Percentage Progress for Project Workflow
Business List Infographic Template
Company Profile Template
Circular Step Infographic
Timeline Infographic Template
Timeline Infographic Element Template
Percent Diagram
Yellow Powerpoint Presentation Design
Green Powerpoint Presentation Vectors
Presentation Infographic Vectors
3D Arrow Design
Pie Chart
Vector Graphs
3D Stats
Infographic Elements Template
Collection of Infographic Element Template
Shiny Stickers
Circular Business Infographic Template